We are what we repeatedly do. Excellence, then, is not an act, but a habit. Consistency is crucial in the eyes of grocery shoppers, and co-op shoppers are no exception. A deep desire for consistency echoes throughout the feedback collected from 68,479 co-op customers at 121 unique co-op locations participating in NCG’s Customer Experience (CX) Program over the past twelve months.
“I used to only shop at the co-op, but the produce selection has become so inconsistent that I now have to plan on making a second stop at the supermarket to get everything I need.”
“Housemade foods aren’t consistent. I have a few premade items I love to buy, but lately, I don’t know what to expect. One time they taste good, the next time they taste totally different. I don’t know why they can’t follow a recipe.”
“I shop later in the evening and staffing is never consistent. Sometimes there is no one at the cheese counter or the deli to help me, even though those areas are supposedly open.”
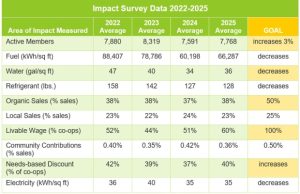
In the following charts, we’ve aggregated the feedback from 68,479 real co-op customers, comparing the top quartile (co-ops with the highest customer satisfaction) and the bottom quartile (co-ops with the lowest customer satisfaction). Each box represents a three-hour window. Green boxes represent the days and times customers are most highly satisfied. Red boxes represent the days and times customers are least satisfied. The range for each day and time is illustrated in bold.


There are some commonalities between the two groups. Both show a pattern of stronger customer satisfaction in the mornings (left side) and weaker satisfaction in the evenings (right side). Interestingly, in both groups, customers are most highly satisfied on Monday mornings from Open to 11am.
The major difference between top-performing co-ops and bottom-performing co-ops, as you might’ve guessed, is consistency — illustrated in the bolded Range by Day and Time boxes.
For example, on Mondays, co-ops in the bottom quartile see a whopping 18-point swing in satisfaction from morning to evening, while top-performing co-ops only see an 8-point swing. Sunday is nearly as striking in variation, as is the 2 PM – 5 PM window and the 8 PM – Close window.
You might be thinking, these charts are kind of complex. But the point they are making is awfully simple: top-performing co-ops prioritize consistency.
Before you read any further, take your manager hat off, and put your customer hat on. The next chart is intentionally blank. Use this blank chart to conduct a thought exercise.

There are 35 blank squares in this chart, each square representing three hours. Your co-op’s hours of operation may vary slightly, but as a manager working a typical 40-hour week, you are likely present in the store for about 15 of these squares. That leaves 20 squares that are potential “blind spots” each week.
Think about when your co-op provides the best and worst customer experiences — from the customer’s perspective.
You can simply print this chart and assign each square a perceived satisfaction score from 0% to 100% with pen and paper. Or you may prefer to use an Excel spreadsheet, color-coding with conditional formatting, as we did above. If your co-op participates in NCG’s CX Program, leverage your dashboard data for this exercise. If not, base your chart on your own insights and customer feedback.
Once you’ve filled out the chart for your co-op overall, gather your team and discuss:
- Alignment with Busy Times – How does the chart align with our busiest and slowest customer count days and times?
- Staffing and Delivery Schedules – How does this chart align with our staffing and delivery schedules? Of course, lots of important work happens at your co-op before store opening and after store closing – but customers generally don’t care and shouldn’t have to.
- Closing the Gap – What practical steps can we take to bridge the consistency gap between our best and worst times?
- Departmental Analysis – Extend the exercise to each department. How do department-level charts differ from the overall store chart? Why? Encourage departments to work towards consistency during both peak and off-peak hours.
Retail Readiness Store Walks
A Retail Readiness Store Walk is an essential tool of retailing; a thorough and conscientious tour through the retail space twice a day to ensure a store is ready to meet customer needs. Done consistently, this is perhaps the strongest tool in our collective toolbox to build the habit of providing a consistently excellent customer experience.
To help kickstart this practice at your co-op, NCG has created a Retail Readiness checklist to use while conducting store walks, in addition to a set of instructions and a Frequently Asked Questions sheet.
For suggestions and assistance in implementing the practice of Retail Readiness Store Walks, please contact your co-op resource manager or regional director. For questions or support with NCG’s Customer Experience (CX) Program, please contact Alex Mytelka.