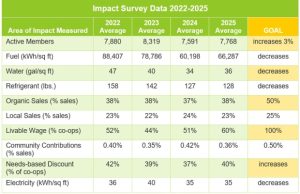
While the 2023 Food Co-op Impact Report shares some of the impact data co-ops reported on this year, it doesn’t provide a complete picture of year-over-year survey results and emerging trends.* In the chart above, you can see how some of the survey questions stack up over the past three years compared to goals we have set for our community of co-ops as a whole. This includes the data that many of you submit through the annual Food Co-op Impact Survey — thank you!
Unfortunately, the group of co-ops responding has fluctuated by question year over year, so this chart does not tell a wholly accurate story. One way to remedy this would be for all co-ops to submit data for as many metrics as they can each year, so that we can evaluate trends based on accurate year-over-year data. NCG has been rethinking the way we assess many metrics since 2020, including more precise language, reimagining of questions, and benchmarking new datapoints — all to make data collection more straightforward and meaningful.
Even without consistent participation, we can still identify some trends over the past few years, both where we are moving in our intended direction as well as areas of opportunity.
How Did We Do?
We met our fuel, water and active membership goals for 2023, and although we didn’t meet any of the other benchmark goals in 2023, looking at trendlines for the data across three years, we are headed in the right direction in many areas.
- Co-ops have shown progress in engaging Active Members — with an upward trend over the past three years and an average active member count of 8,319 in 2023, exceeding our goal to increase active membership by 3% annually.
- Fuel Usage is another win — co-ops made progress between 2022 and 2023, decreasing fuel consumption by 10%. While 2022 was a “benchmark” year (in which we established our baseline for calculating fuel use) and it is too early to detect a clear trend, if this direction continues, NCG co-ops will meet our goal to collectively decrease fuel use year over year.
- Water Usage was another area where co-ops made progress in 2023 from the benchmark year of 2022, when we established a baseline for water usage as calculated per square foot. Collectively, co-ops’ water use decreased by about 15%.
- Also worth celebrating, Refrigerant Gas Use has been on an overall decline since 2021, decreasing by 32%. Refrigerant gases are among the most harmful to our atmosphere and focused attention on decreasing them is among the most important things grocers can do to slow climate change.
- In the neutral zone, Organic Sales have remained pretty flat over the past three years, trending slightly down. In 2023, 38% of NCG co-ops’ annual sales came from organic products. Compared to conventional stores where just 2.5% of sales were from organic products, and natural retailers at 23% of sales, the NCG system on average is a high performer.
- Similarly, Local Sales have trended slightly down over the past three years. However, at 22% of sales coming from local products and the average co-op working with 169 local producers, NCG co-ops in 2023 were well ahead of the average food retailer operating less than 10 stores, which reported partnering with 41 local farms, according to 2023 data from FMI.
Co-ops appear to be struggling to make improvements in the following areas:
- Co-ops offering all employees a Livable Wage has trended upward since 2020 but peaked in 2021. With a goal of 100% of co-ops paying all staff a livable wage, there is still opportunity here as only 44% of co-op survey respondents in 2023 offered a livable wage to all staff. NCG offers support and resources for co-ops interested in the Co-op Livable Wage and Benefits Model.
- Charitable Donations have trended down as a percentage of total sales since 2020.
- While the percentage of co-ops offering Needs-Based Discounts remained consistent between 2021 and 2022, in 2023 this number was down to 39% suggesting that NCG as a system is trending down in this area. While the group of co-ops that answered this question was different year over year and NCG has made the language around this question more precise, this is an area of opportunity for the future. NCG offers a preferred practice resource for co-ops interested in offering a needs-based discount.
- Electricity Usage appears to be increasing since the benchmark year of 2022, when we began tracking resource use per square foot. Co-ops can access resources to reduce electricity usage on the NCG website.
Gratitude, Collaboration and Inspiration to Keep Going
NCG is grateful to all co-ops that participated in the Impact Survey this year. Thank you for dedicating time and energy to collect and share data that helps your advocacy and sustainability team better understand where to invest resources that can help co-ops improve their social and environmental sustainability.
Co-op staff who work on the Impact Survey or have sustainability-related responsibilities are invited to join me on monthly sustainability staff catch-up calls (provided that they have approval to do so during working hours). On these calls, we come together to collaborate, build community and encourage each other to make the changes in our stores that make a difference to our communities and the world.
* NCG reports to our board of directors and co-op designated representatives (DRs) on all metrics annually in the annual NCG Ends Report. Additionally, Co+efficient users can use the dashboards feature to analyze their co-op’s year over year progress and compare progress with their peers.