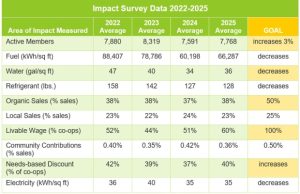

How do food co-ops give back to the community? Let me count the ways! By providing good jobs, supporting local suppliers and the local economy, making nutritious food available, through education and outreach, to name a few. Each January, co-ops track their progress in these areas by participating in NCG’s Food Co-op Impact Metrics. This tracking of key measures allows each co-op to benchmark where they are, seeing the areas where they are performing as well as they’d like, and areas where they can improve. Over the past few years, some interesting trends about co-ops’ amazing generosity have emerged.
Co-ops love sharing their best ideas and borrowing the best ideas from others. This exchange is certainly the case with healthy food access programs, which offer special assistance to people with limited financial means. When NCG first started tracking the prevalence of these programs as an Impact Metric, fewer than half of co-ops reported having one (45% in 2016). Today, two-thirds of co-ops report offering healthy food access programs, with the value of assistance averaging over $69,000 annually per co-op. That’s $69,000 worth of nutritious food for neighbors who may not have otherwise felt the co-op was there to serve them.
Willy Street Co-op in Madison, Wisconsin, is a shining example of finding creative ways of inviting shoppers of all income levels into their stores. Learn about their Access Discount Program, offering 10% off plus the option to make incremental payments toward membership, and their Double Dollars produce program in the Willy Street case study.
Brattleboro Food Co-op in Brattleboro, Vermont, is another fantastic example of actively tracking and sharing the impacts of their Food for All program with members by featuring their progress in the annual report. The co-op’s annual Food for All discounts grew from $44,000 in 2016 to $88,000 by 2019.
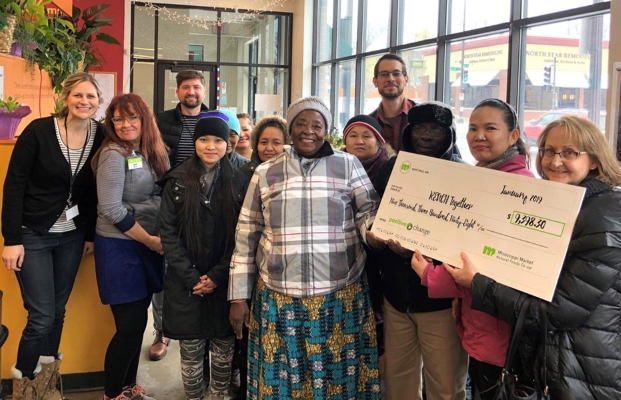
Community giving is another indicator of co-ops’ incredible capacity for giving back. Impact Metrics data show that co-ops donate an average of $70,000 per year through cash and in-kind donations, register donations and volunteering, combined. When a co-op participates in this type of giving, the support often stays within the local community where it benefits neighbors and builds goodwill for the co-op.
BriarPatch Co-op in Grass Valley, California, runs community giving programs that amplify the co-op’s mission of providing healthy, local food. One particularly inspiring example is their sponsorship of the Culinary Job Training Program with their local homeless shelter, which culminates with the graduates preparing a meal for shelter guests made entirely with food they have selected from the co-op. Read more in the BriarPatch case study.
Feeling inspired after seeing these examples? Whether your co-op has formal programs in place and is interested in how to better track community giving, or this article is the spark you need to establish giving programs at your co-op, we can help. Contact NCG Advocacy Senior Director Allie Mentzer to learn more.
Below is a summary of co-op giving data from Impact Metrics in 2016, 2017 and 2018. Join us in collecting the most recent data from 2019 this coming January in Co+efficient.
Does your co-op have a healthy food access program? (Co-ops responding “Yes”)
- 2018 Co-op Average: 67%
- 2017 Co-op Average: 63%
- 2016 Co-op Average: 45%
What is the total value of discounted food through your healthy food access program?
- 2018 Co-op Average: $69,465
- 2017 Co-op Average: $47,837
- 2016 Co-op Average: $65,393
What’s the total value of your community giving (cash, in-kind, register donations and volunteering)?
- 2018 Co-op Average: $70,835
- 2017 Co-op Average: $46,348
- 2016 Co-op Average: $32,612
What is your co-op’s giving as a percent of total sales?
- 2018 Co-op Average: 0.43%
- 2017 Co-op Average: 0.40%
- 2016 Co-op Average: 0.20%